Pharmaceutical Industry Statistics: Unveiling the Global Biotech Landscape in 2026

From groundbreaking therapies to cutting-edge research, the biotech sector has emerged as a global powerhouse.
In this article, we delve into the captivating realm of biotech, exploring statistics - including the impressive global pharmaceutical revenue by technologies, the value share of the biotech sector worldwide by country, and the number of public biotech companies in the United States.
These metrics provide the most up-to-date information in biotech stats as of 2024.
Global overview
Global market growth to exceed $1 trillion
The global prescription drug market is projected to see significant growth between 2022 and 2030. In 2024, worldwide prescription drug revenue is expected to reach $1.12 trillion, with revenues anticipated to surpass $1.7 trillion by 2030. This growth is fueled in part by the rising demand for orphan drugs, which are specialized treatments designed for rare diseases.
Global pharmaceutical revenue by technology
Global pharmaceutical revenue from 2012 to 2026 is categorized across different technologies. Biotechnology accounted for $266 billion in drug revenues in 2019, a figure that has been steadily growing for the past several years. It is projected to reach $505 billion by 2026, while the conventional drug market is expected to be worth $681 billion that same year.
Value share of the biotech sector worldwide by country
In 2021, the United States emerged as the dominant force in the global biotech industry, commanding nearly 59% of the total global biotech value. Meanwhile, China accounted for approximately 11%.
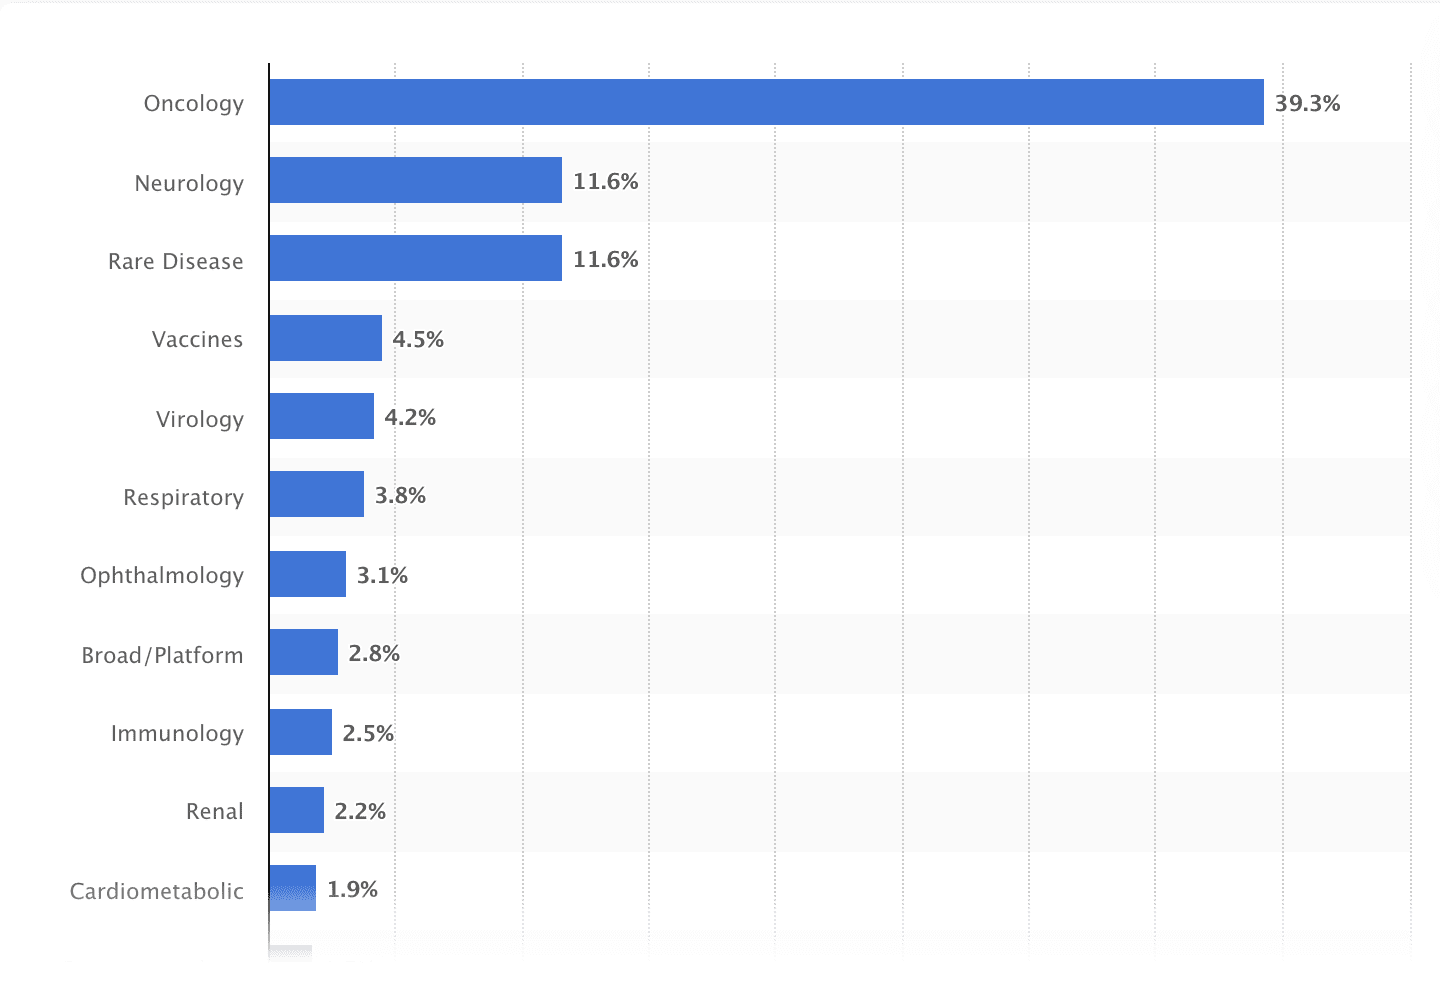
Value share of the biotech sector worldwide by therapeutic area
The global biotech sector witnessed the dominance of oncology, which commanded a substantial value share of approximately 39%. This underscores the immense focus and investment in advancing cancer treatments and therapies.
The therapeutic landscape of the biotech sector also revealed other significant areas of interest. Neurology and rare diseases each held an 11.6% value share, reflecting the growing attention given to understanding and addressing neurological disorders and rare medical conditions.
Top global biotech companies selection based on market cap
In November 2022, Roche, a company based in Switzerland, was the top biotech company in the world with a market capitalization of $268.27 billion. US-based AbbVie came in second with a market cap of nearly $257 billion during the same period while Danish biopharmaceutical manufacturer Novo Nordisk ranked third with approximately $192 billion.
Top global biotech companies based on number of employees
As of 2022, Danish biopharmaceutical manufacturer Novo Nordisk had nearly 48,000 persons employed worldwide.
US and European landscape
Number of public biotech companies in the US by region
With a total of 107 public biotech companies operating in the region, Northern California ranked second among the top biotech regions in the country. Massachusetts held the leading position with 152 public biotech companies, a testament to its advanced biotech ecosystem.
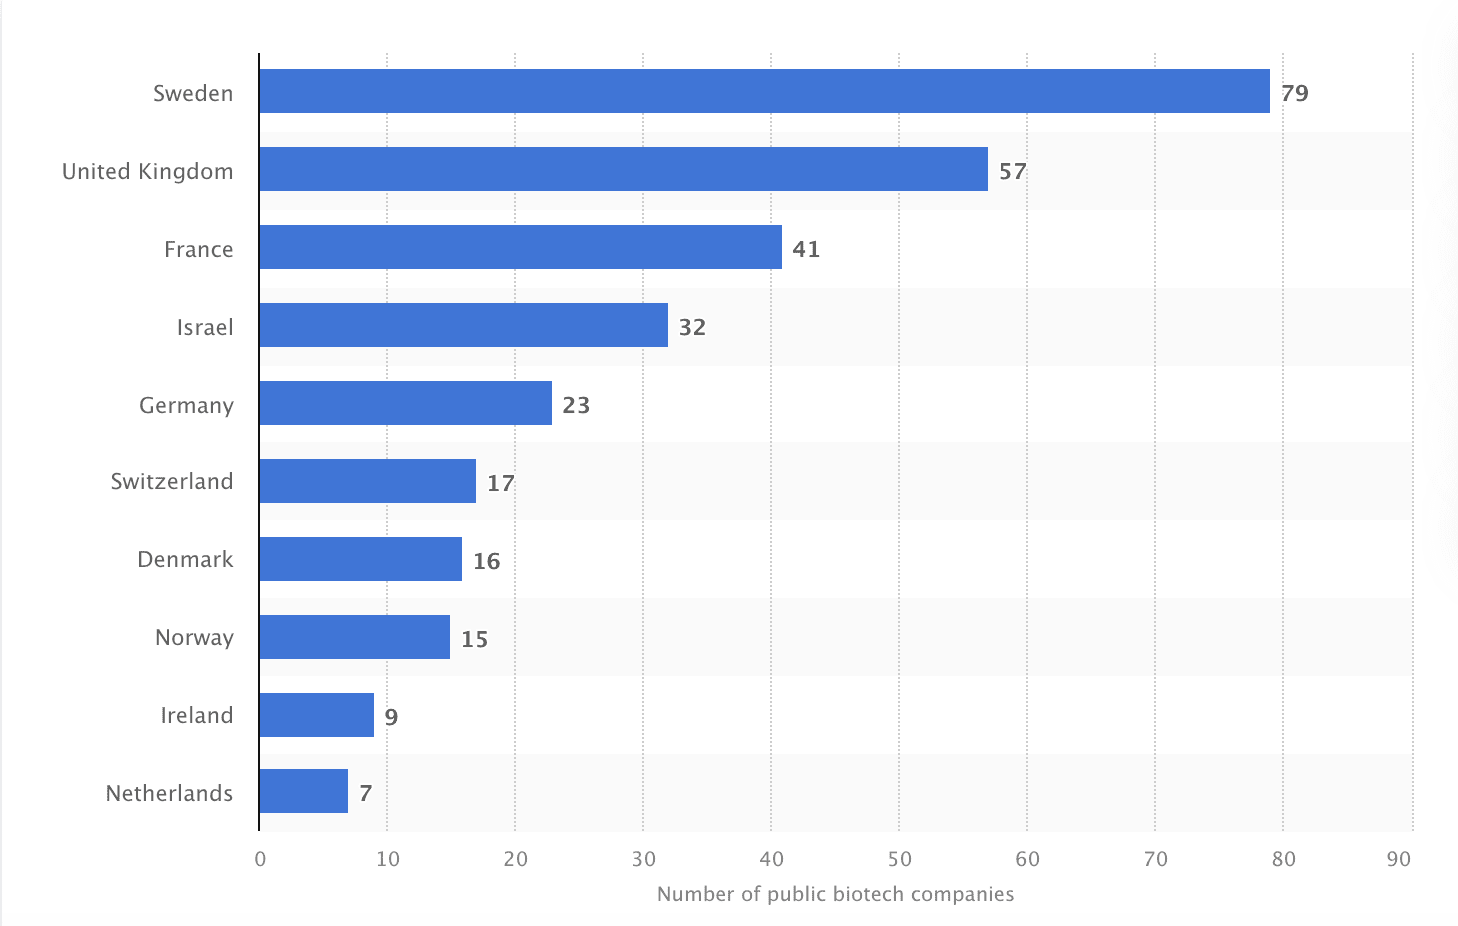
European countries based on the number of public biotech companies in 2021
Sweden led the way in Europe with 79 public biotech companies, followed by the UK with 57, France with 41, and Germany with 23. The Netherlands ranked lowest on the list, with only seven public biotech companies.
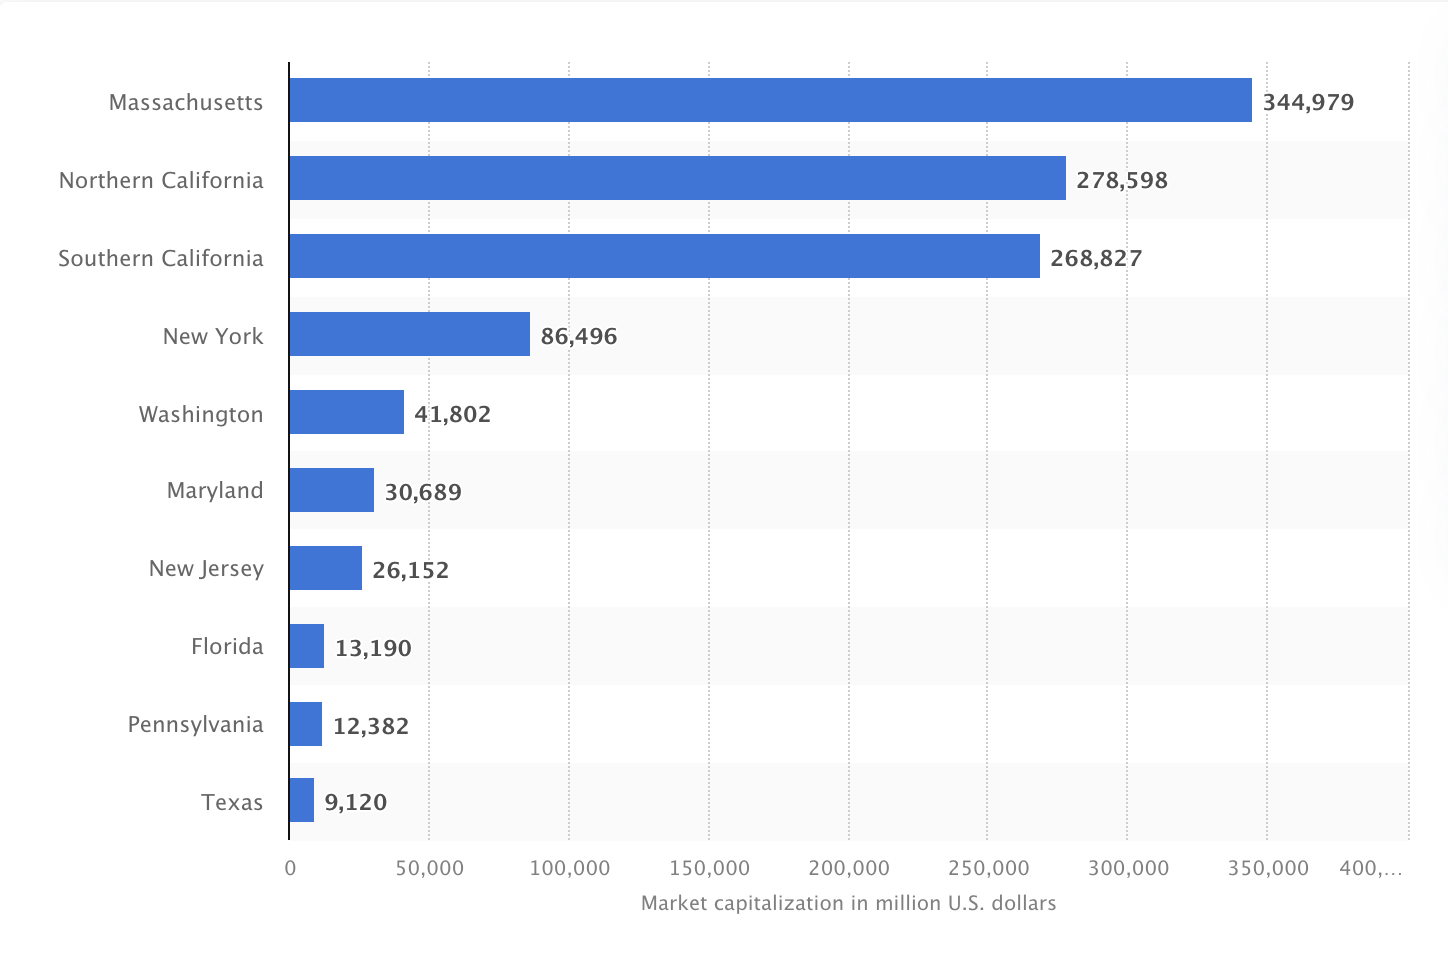
Market capitalization of US biotech companies by region
Massachusetts and Northern California have some of the most successful public biotechnology companies in the United States, totaling $344,979 million and $278,598 million in market capitalization, respectively. Southern Californian public biotech companies have a market capitalization of $268,827 million, while those in New York are worth $86,496 million.
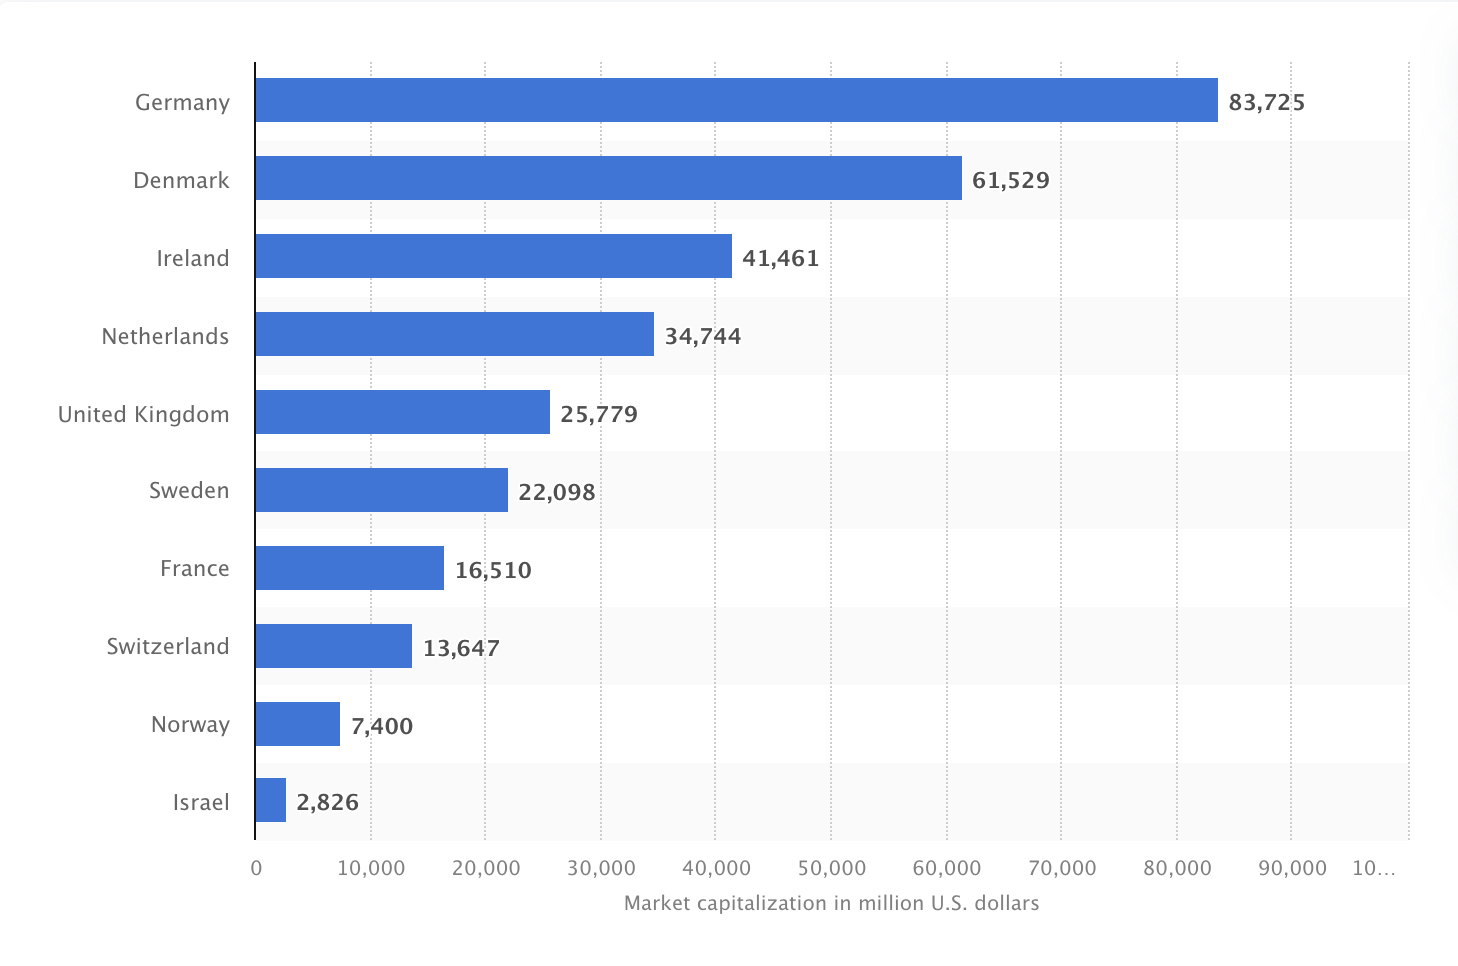
European countries by public biotech company market capitalization
Germany emerged at the forefront, boasting the highest market capitalization of nearly $83,725 million. This achievement was primarily driven by the success of BioNTech, renowned for its groundbreaking COVID-19 vaccine Comirnaty.
Denmark secured a significant market capitalization of $61,529 million, followed closely by Ireland with $41,461 million.
The Netherlands showcased a robust presence with a market capitalization of $34,744 million, while the UK and Sweden exhibited notable figures of $25,779 million and $22,098 million, respectively.
Focus: US companies
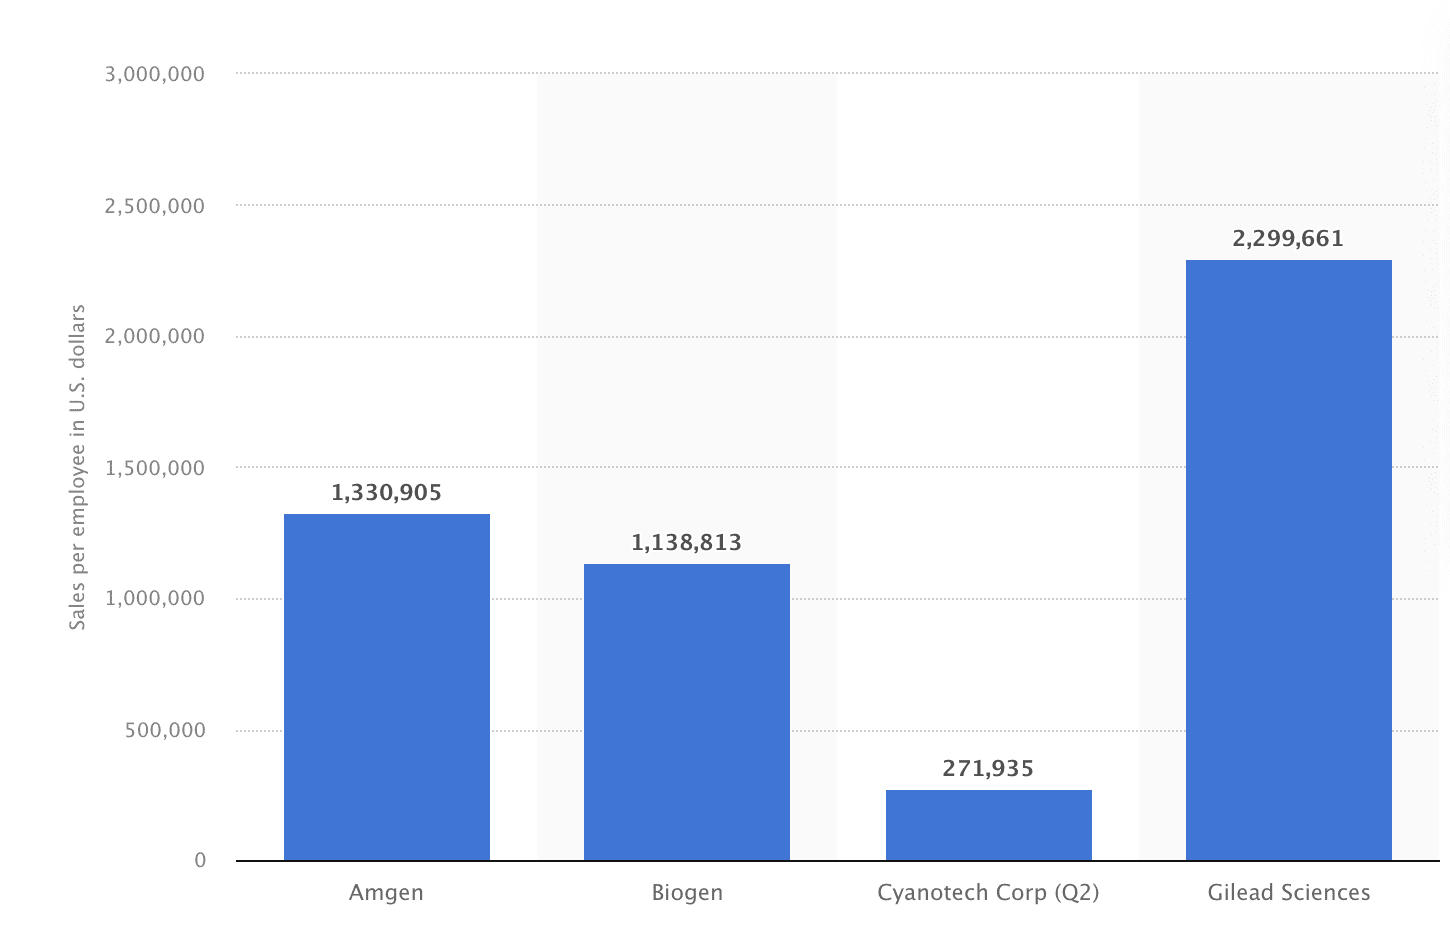
Sales per employee of select US biotech and drugs companies
As of the third quarter of 2022, US biotech company Gilead Sciences reported $2.3 million in sales per employee for the preceding twelve months. Amgen and Biogen came in second and third, with sales-per-employee figures of roughly $1.3 million and $1.13, respectively.
Research & development
Clinical trial retention remains a massive problem
Trial retention remains a critical factor in the success of clinical studies, yet significant challenges persist. According to Accenture:
- Awareness Gap: Only 5-10% of eligible patients are aware of ongoing clinical trials, highlighting a major hurdle in recruitment.
- Dropout Rates: 30% of patients discontinue participation due to non-clinical issues, such as logistical challenges or lack of support.
- Early Terminations: 19% of trials close or terminate prematurely because of insufficient participants, resulting in an estimated $800 billion in lost value.
Top global biotech companies - R&D expenditure
In 2021, Danish biopharmaceutical major Novo Nordisk demonstrated a strong commitment to research and development in the field of biotechnology, spending $2.7 billion on R&D. Metrics such as R&D intensity (13.6%), productivity and success rate all suggest that Novo Nordisk’s investment in research and development is paying off well.
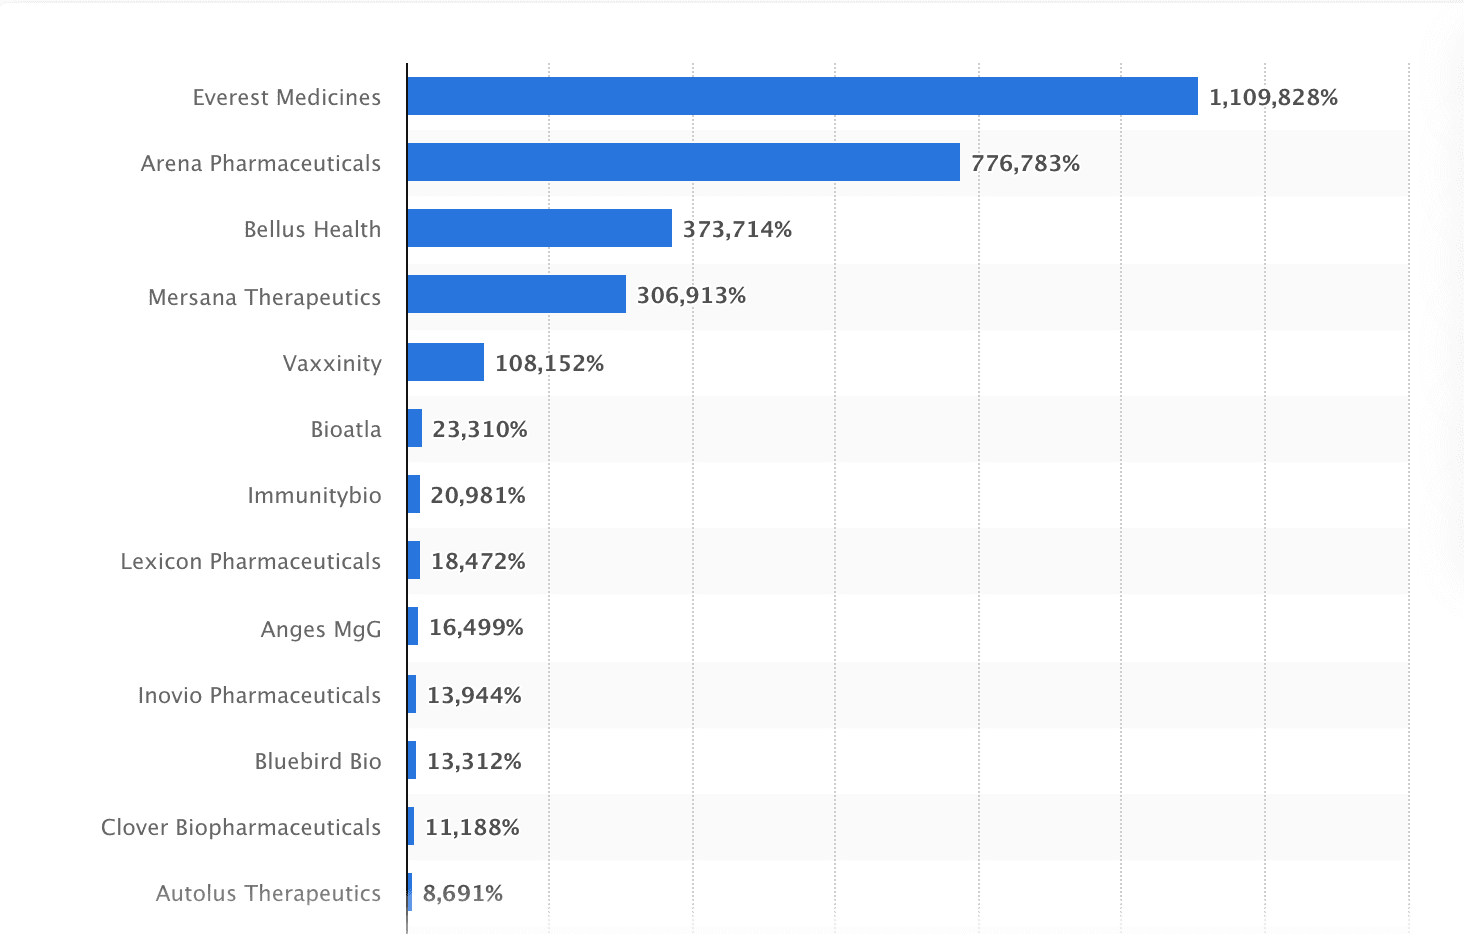
Top 50 global pharmaceutical and biotech companies by R&D intensity
R&D intensity is calculated by taking a company’s R&D expenditure and dividing that figure by its sales. Everest Medicines had the highest R&D intensity at 1,109,828% and Arena Pharmaceuticals came in second at 776,783%.
Average R&D cost to develop new biopharma
According to the data, the average cost to develop a new drug is approximately $2.3 billion.
Rate of return on biopharmaceutical late-stage R&D pipeline
The internal rate of return (IRR) on biopharmaceutical late-stage R&D pipelines varied between 2013 and 2022. The rate of return decreased from 7.2% in 2014 to 1.5% in 2019. The numbers increased to 6.8% in 2021 before another sharp decline to 1.2% in 2022.
Products
AI in drug discovery to reach $3 billion
AI investments in the pharmaceutical industry are projected to reach $3 billion by 2025, as companies leverage the technology to reduce drug development time and costs.
Global biotech drugs sales
In 2012, biotechnology drugs generated sales amounting to $149 billion. However, this figure was projected to surge to over $420 billion by 2022. This significant increase highlights the expanding market presence of biotech drugs and their growing share in the overall global pharmaceutical industry.
Other estimates indicate a growth to USD 1,683.52 billion by 2030.
Projection of top 2023 pharma and biotech launches by revenue
A highly anticipated product launch in the biotech and conventional pharmaceutical sectors is the Alzheimer’s disease treatment Lecanemab, jointly developed by Eisai and Biogen. It is scheduled for launch in 2023 and is expected to generate approximately three billion US dollars in revenue by 2028.
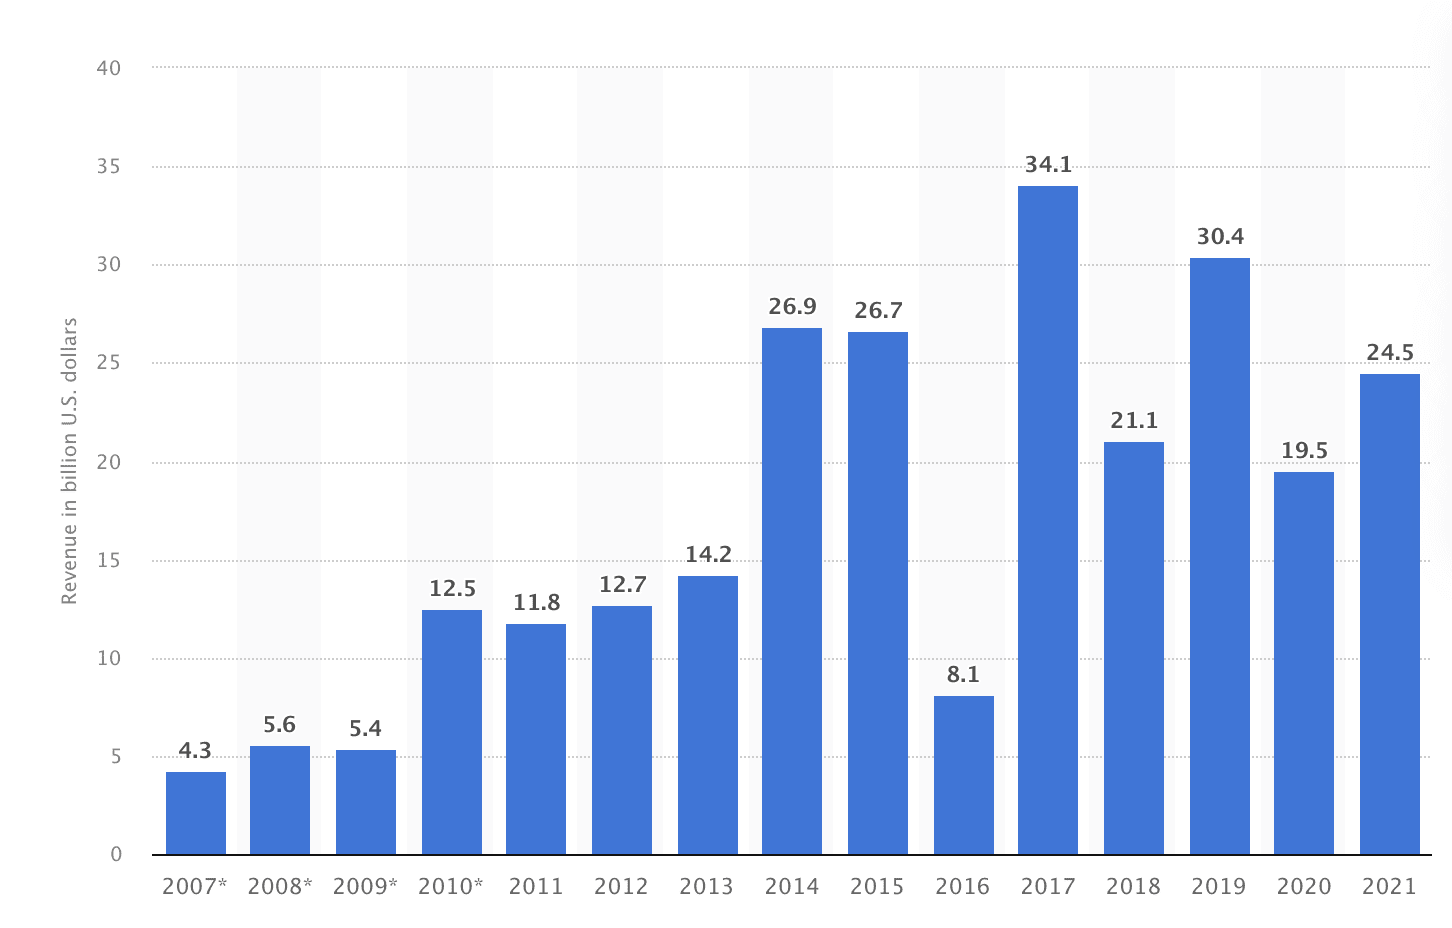
Total US pharma and biotech product sales 5 years after launch
In 2021, product revenues in the US totaled $24.5 billion for products launched five years earlier. This is a sharp increase from 2007, when sales under the same heading were valued at $4.3 billion.
US biopharmaceutical export volume
The value of US biopharmaceutical exports quadrupled between 2002 and 2021 to reach an estimated $83 billion.
Funding/M&A/IPOs
Total raised capital in US and Europe biotechnology industry
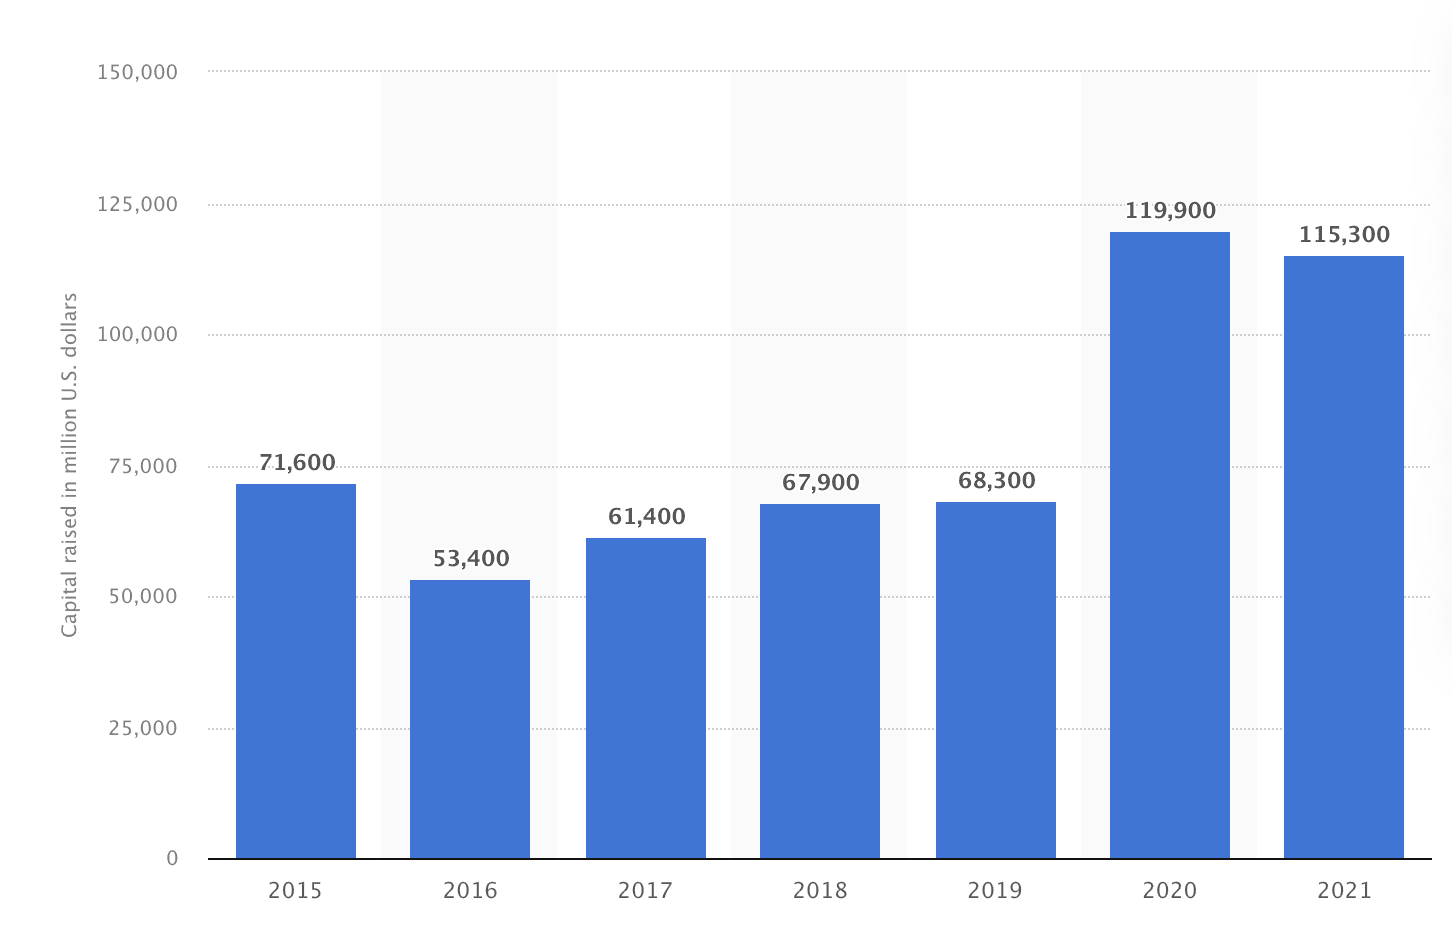
In 2021, the combined biotech industry in the US and Europe raised over $115,300 million in capital, including risk capital, IPOs, follow-on, and debt. This was a fall from the capital raised in 2020, which stood at $119,900 million.
Venture capital in US and Europe biotechnology industry
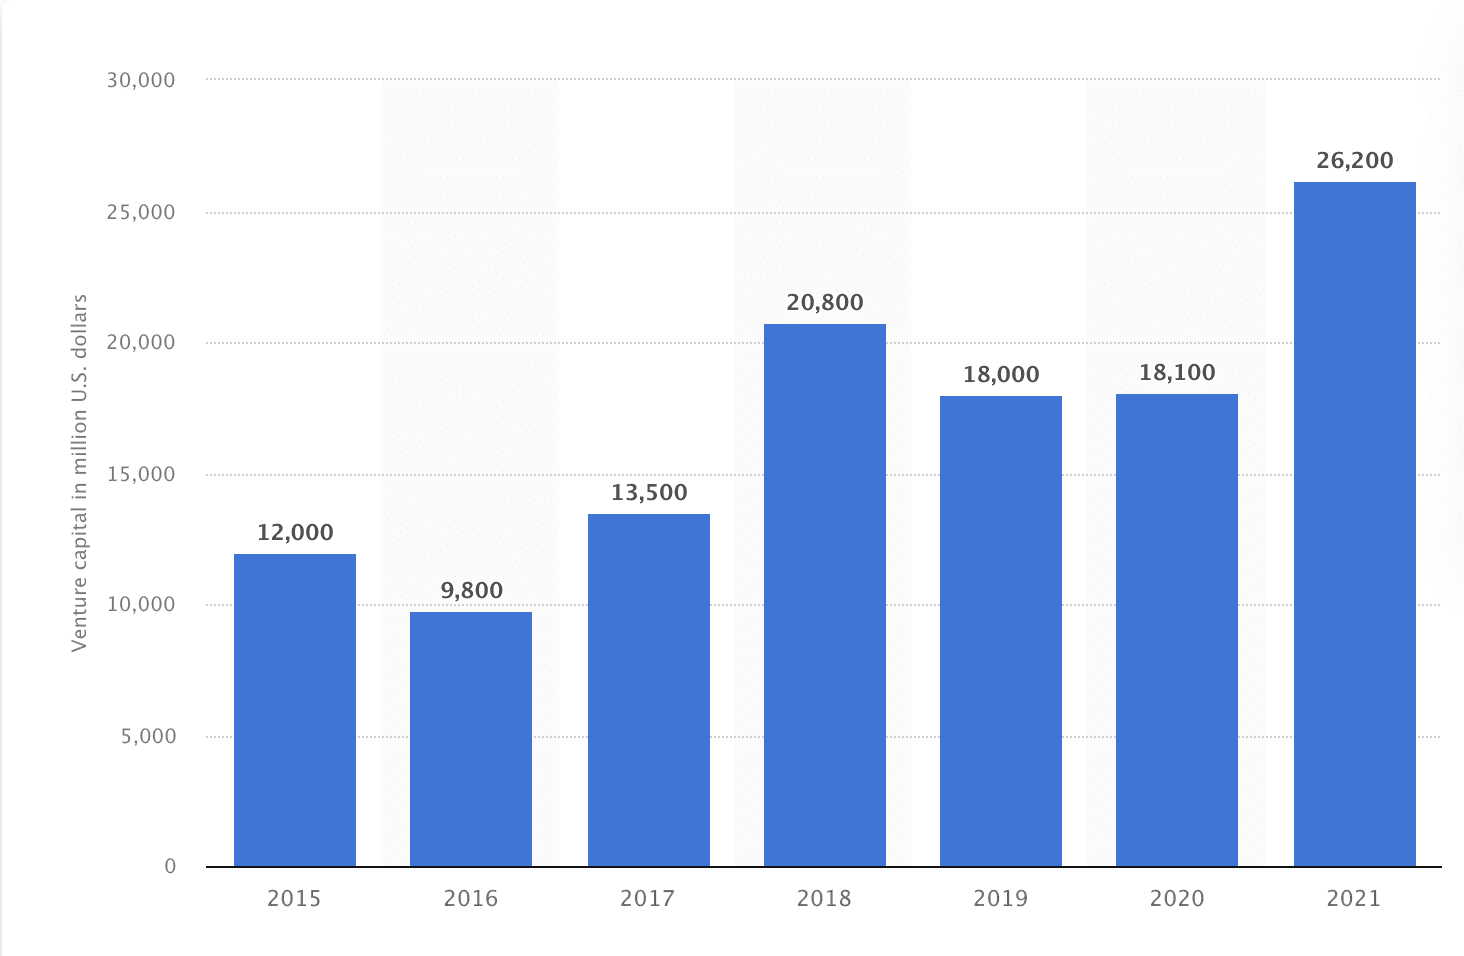
In 2021, the biotech industry in the US and Europe raised over $26 million in venture capital. This was a large increase from the amounts raised in 2019 and 2020, which were $18 billion and $18.1 billion, respectively.
US bioscience venture capital investments by segment
Over $53 billion was invested into healthcare technology systems from 2018-2021.
Biotechnology funding by National Institutes for Health
The National Institutes of Health (NIH) played a significant role in funding biotechnology research and development in the United States. In fiscal year 2021, the NIH allocated approximately $7.85 billion toward biotechnology funding.
Select M&As involving US and European biotech companies
2022 saw several M&As involving US and European biotech companies. Amgen acquired Horizon Therapuetics, a deal with a potential value of €27.8 million. Meanwhile, Pfizer took over Biohaven Pharma, which was valued at €11,600 million.
Compensation in biotech
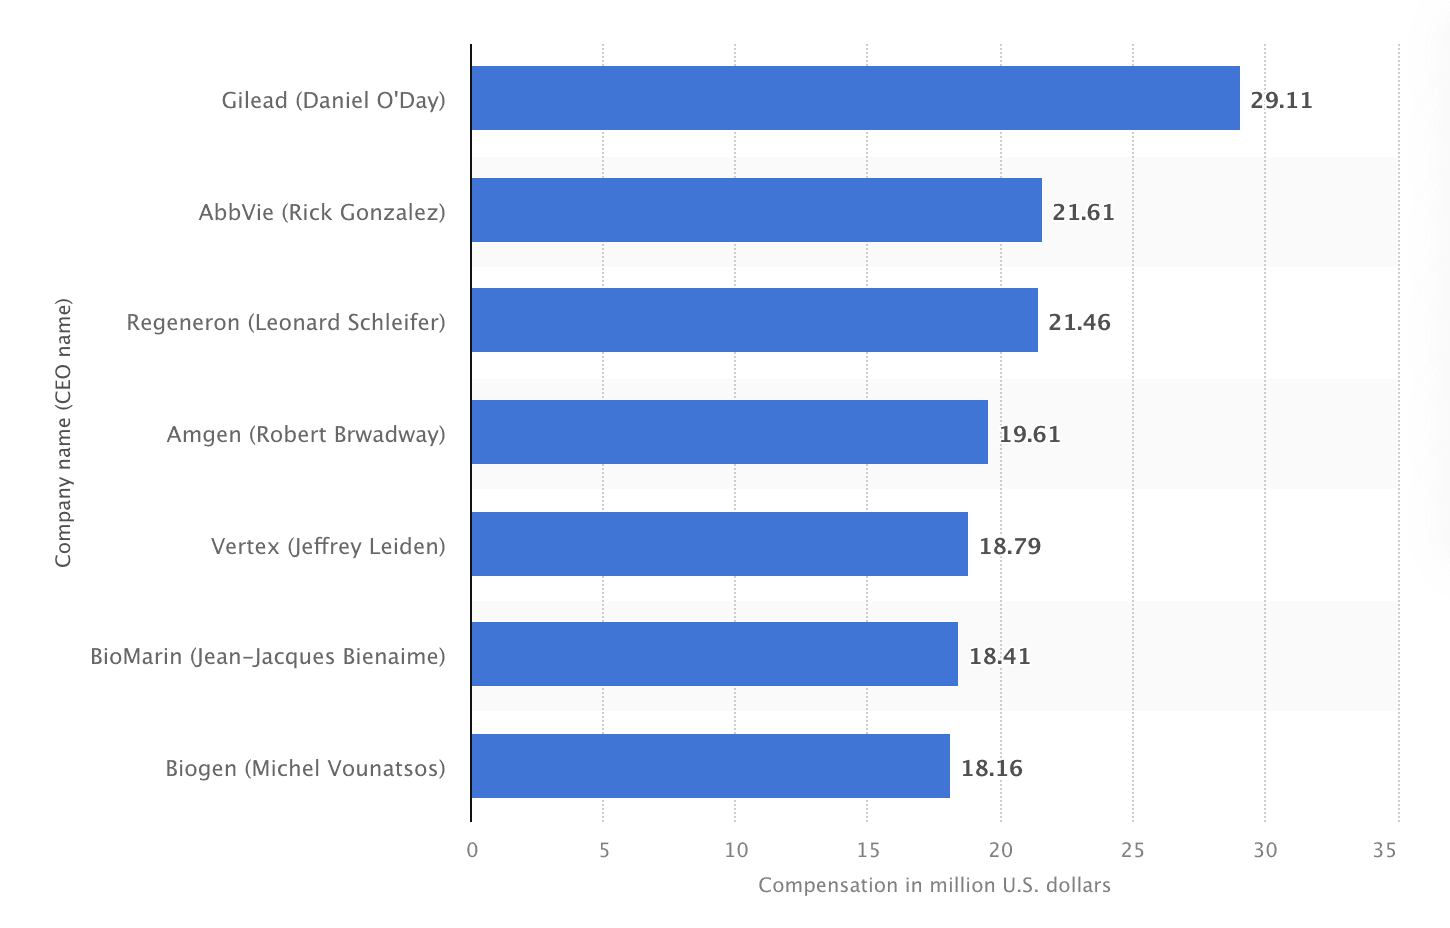
Select large biotech firms by CEO compensation
In 2019, several large biotech companies awarded significant CEO compensation. Daniel O’Day of Gilead received $29.11 million, Rick Gonzalez of AbbVie took home $21.61 million, Leonard Schleifer of Regeneron received $21.46 million, and Robert Bradway of Amgen was richer by $19.61 million.
These compensation figures reflect the recognition and remuneration bestowed upon these CEOs for their leadership and contributions to their respective biotech companies.
Top biotech & pharma firms by median employee pay
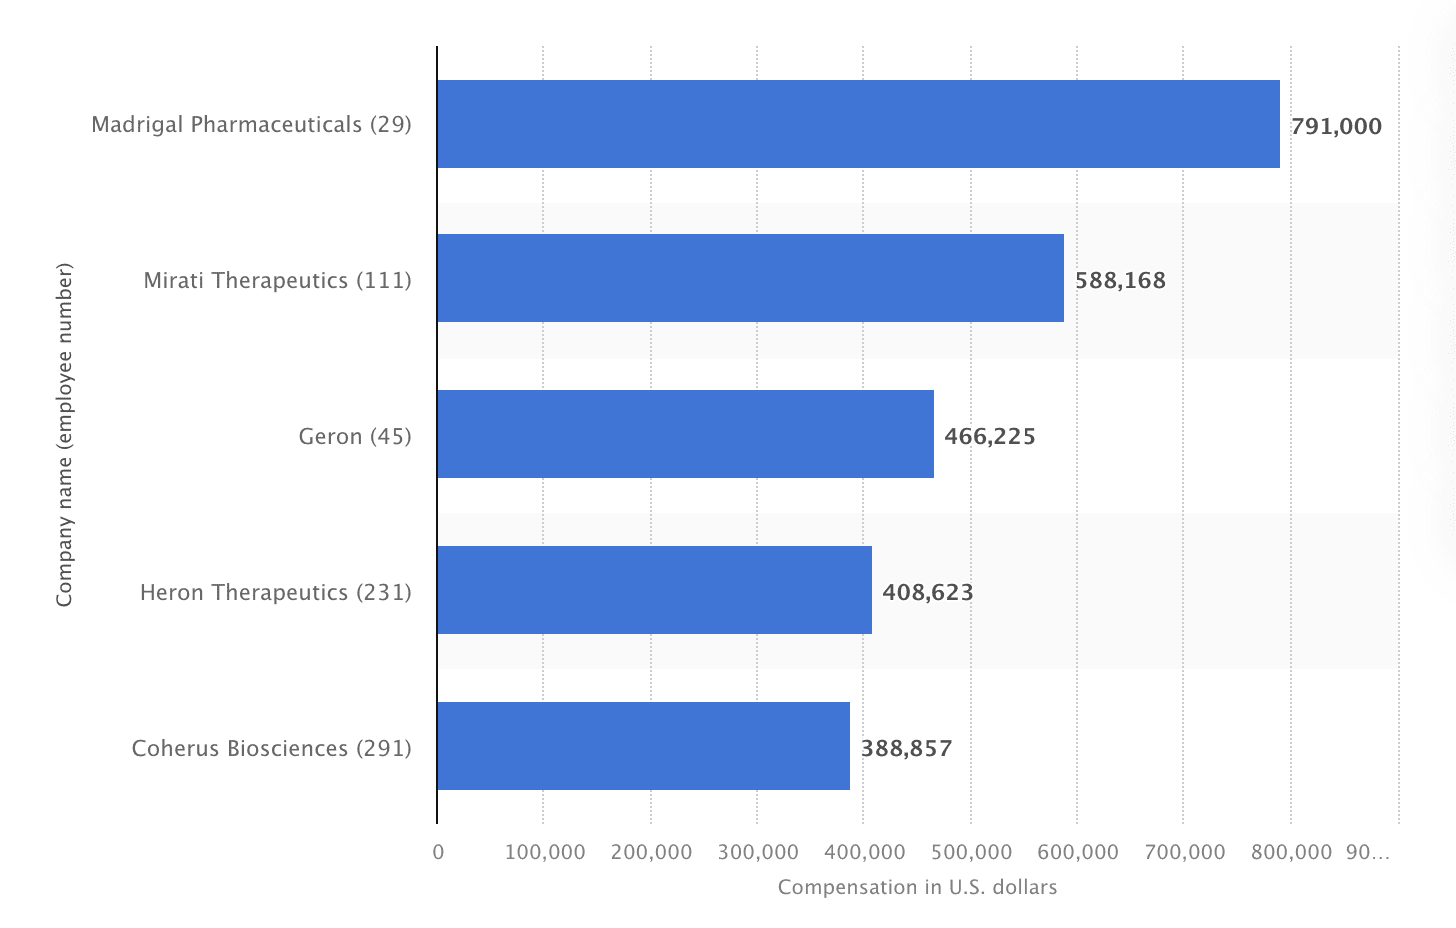
In 2019, Madrigal Pharma secured the top spot for median employee compensation among 231 surveyed companies in the biotech and pharma sector. The median employee at Madrigal Pharma received a remarkable compensation of $791,000 that year. Mirati Therapeutics came in second, offering employees a median compensation of $588,168.
Widest CEO-employee pay gap among biopharmaceutical firms
In 2019, Mylan NV had the widest CEO-employee pay gap among biotech and pharmaceutical companies. Mylan’s CEO received a compensation package that was 427 times higher than the median pay of an employee that year.
Smallest CEO-employee pay gap among biopharmaceutical firms
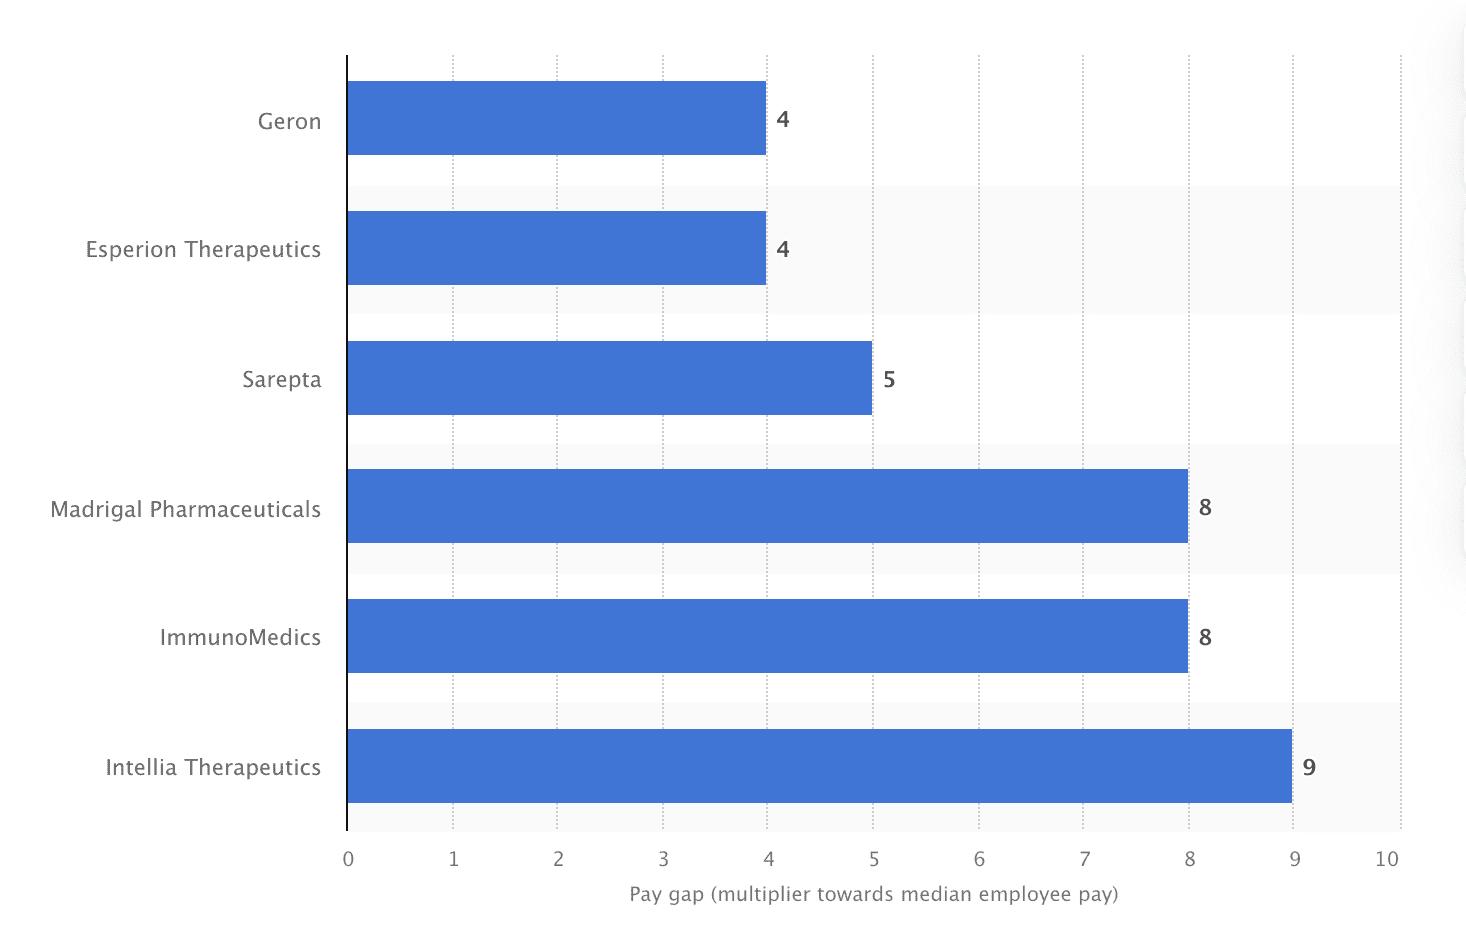
Geron and Esperion Therapeutics had the lowest CEO-employee pay gap among biotech and pharmaceutical companies, with their CEOs getting just four times the median employee salary. In contrast, Instellia Therapeutics recorded the highest pay gap with a 9x difference between the salary of the CEO and a median employee.
Top biotech female CEO compensations
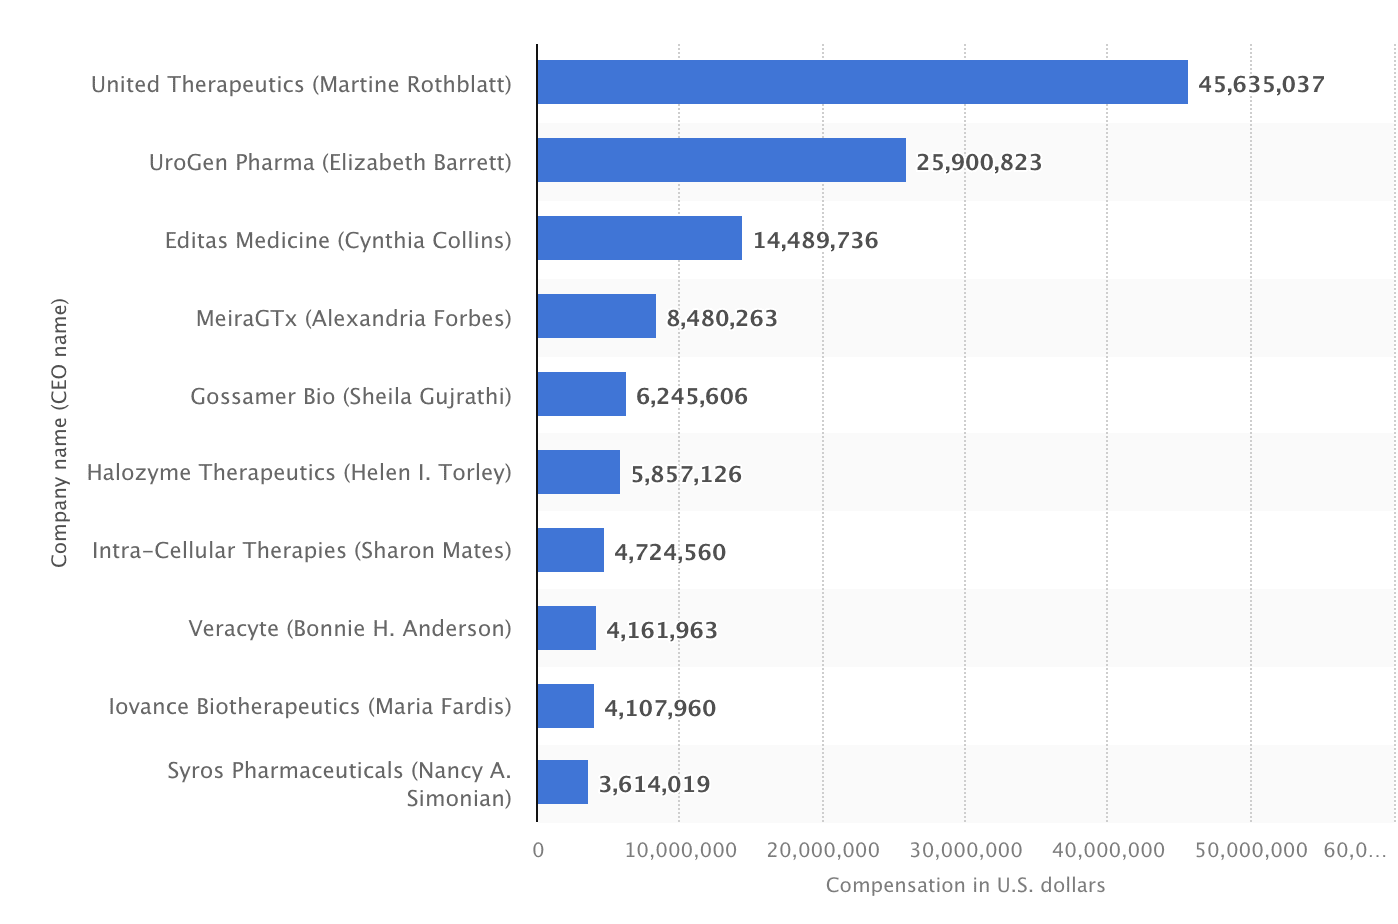
The CEO of United Therapeutics, Martine Rothblatt, received a total compensation of roughly $46 million, which made her the best-compensated female biotech CEO. She was followed by Elizabeth Barrett, CEO of UroGen Pharma, who earned close to $26 million, and Cynthia Collins, CEO of Editas Medicine, who received $14.48 million.
Pharma Statistics in 2024
We hope our exhaustive exploration of key statistics of the biotech industry has helped shed light on various aspects of this critical sector. From global pharmaceutical revenue distribution by technology to the value share of the biotech sector worldwide, these figures capture the immense scale and potential of biotechnology.
As the biotech industry continues to thrive and revolutionize the world of healthcare, companies need to effectively communicate their innovations, breakthroughs, and value propositions.
Step into the spotlight with Digital Elevator, the leading biotech marketing agency ready to amplify your brand’s impact. Schedule a discovery call with our experts today to find out more!
Founder and CEO of Digital Elevator. 15+ years of marketing experience helping businesses compete and win online, from emerging startups to Fortune 100 leaders.